CUDA Boids Flocking
GPU flocking simulation with naive, scattered, and coherent uniform grid neighbor search
Overview
This project implements Craig Reynolds’ boids flocking simulation in CUDA, where each particle represents a boid and their positions are updated based on the 3 rules of cohesion, separation, and alignment. Built for CIS 5650 GPU Programming and Architecture at the University of Pennsylvania.
Source code on GitHub. Tested on Windows 11, AMD Ryzen 5950X @ 4.3GHz, 64GB RAM, RTX 3090 24GB.
Implemented Approaches
- Naive O(N^2) neighbor search that iterates through every other particle for each particle.
- Scattered uniform grid. Sort boid indices by cell, find each cell’s start/end, and find neighbor boids within the max rule distance.
- Coherent uniform grid. Same as scattered, but positions and velocities are shuffled into cell order first so the neighbor loop reads contiguous memory instead of going through an index array and doing random memory access.
- The three velocity kernels share the same rule math (
accumulateNeighbor/finalizeVelocityChange), so any timing difference between them is the neighbor loop, not the rules. - Toggles are at the top of
src/main.cpp:UNIFORM_GRID,COHERENT_GRID,VISUALIZE, plus aPROFILEswitch I added for the measurements below.
Performance Measurement
I figured just watching the FPS counter is not a great way to measure performance, and the FPS counter in the window title turned out to be an inaccurate indicator anyway. With 50k boids the coherent step takes 0.25 ms of GPU time, but one loop iteration takes 0.77 ms. The other half millisecond is the GL buffer stuff, the window title update and event polling.
So I added a PROFILE macro in main.cpp:
- A
cudaEventpair around the simulation step call, synced every frame, gives the GPU time of just the step. This is the “step ms” everywhere below. - The wall-clock time of the whole loop iteration is also recorded per frame. FPS = 1000 / mean of that. Pretty much the same thing the title bar fps measures, but averaged over the entire run.
- Both go into a preallocated vector and get written as a CSV when the run exits, so the logging cost is insignificant during the run. The program runs a fixed number of steps (label, N and step count come from the command line) and closes itself.
glfwSwapInterval(0)underPROFILEso I can leave my Nvidia vsync settings at “application based” with no need to toggle the global setting. (Definitely did not do this because I would forget to turn it back on when gaming and get bad tearing)
Setup for every performance graph here: Release build, block size 128 and cell width 2x the max rule distance unless stated, VISUALIZE 0 unless stated, 3000 steps per run with the first 200 thrown away as warm-up (naive at 50K, 100K and 200K got fewer steps because it would take 10 years to finish 3000). Initial positions are seeded deterministically, so step k is the same world in every mode. Other programs were minimized while running, since I noticed they were eating around 20% of my GPU.
Scripts and raw data: profiling/run_sweep.ps1 runs a sweep, profiling/analyze.py makes the tables and graphs, profiling/raw/ has every per-frame CSV, profiling/summary.md has every number.
Note: the profiling PowerShell and Python scripts were created with the help of AI.
Results
Boid count (note that the Y axis is log-scaled)
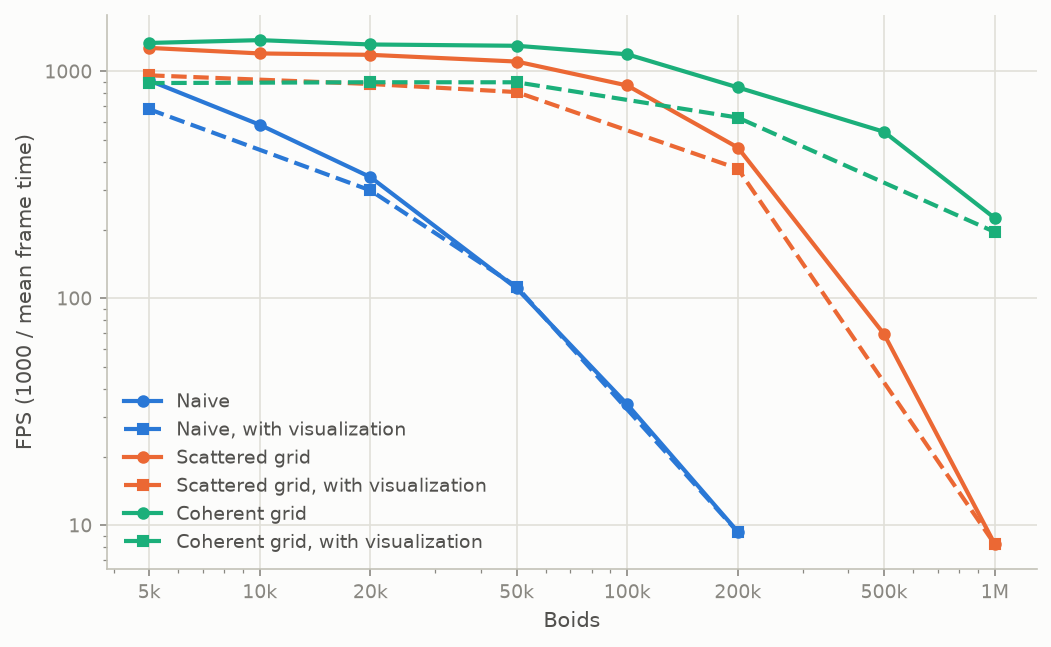
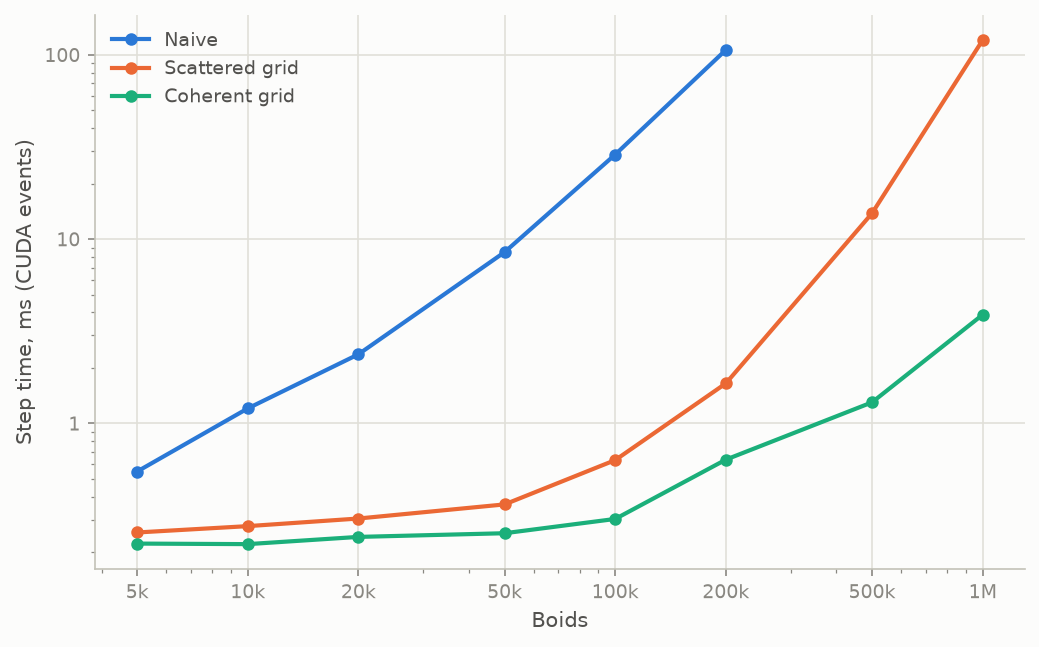
- Naive scales very poorly once the GPU is full. Below 20k it grows slower than quadratic because 5k boids is only 40 blocks of 128 threads and the 3090 has 82 SMs, so half the GPU is idle.
- Both grid modes are pretty much flat until about 100k. My guess would be that around 0.3 ms is the cost for launching the kernels plus the thrust sort, and at these sizes the actual work is smaller than the overhead.
- Scattered falls drastically after 200K: 1.6 ms, then 13.8, then 120. Coherent goes 0.64, 1.3, 3.9 over the same range. I believe this has to do with the cache size of my GPU. More details in the Coherent vs Scattered section below.
- Visualization on doesn’t (and shouldn’t) change the step time at all, it just adds the draw and swap to each frame. At 50k that’s about 0.3 ms per frame, which is why FPS drops from 1300 to 900 while the step is unchanged.
Block size (note that the Y axis is log-scaled)
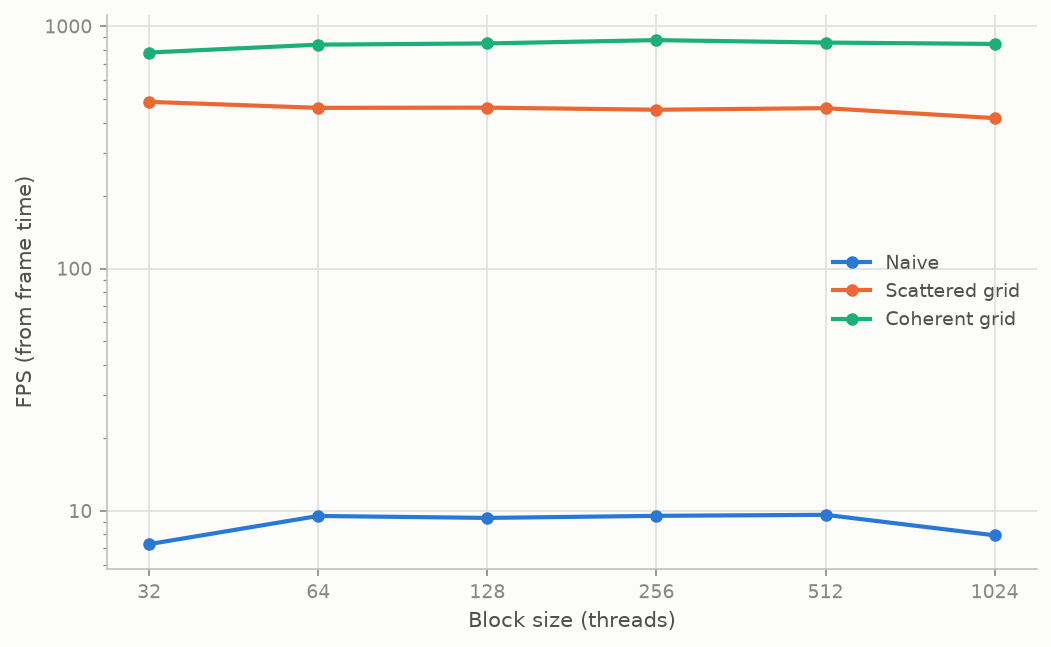
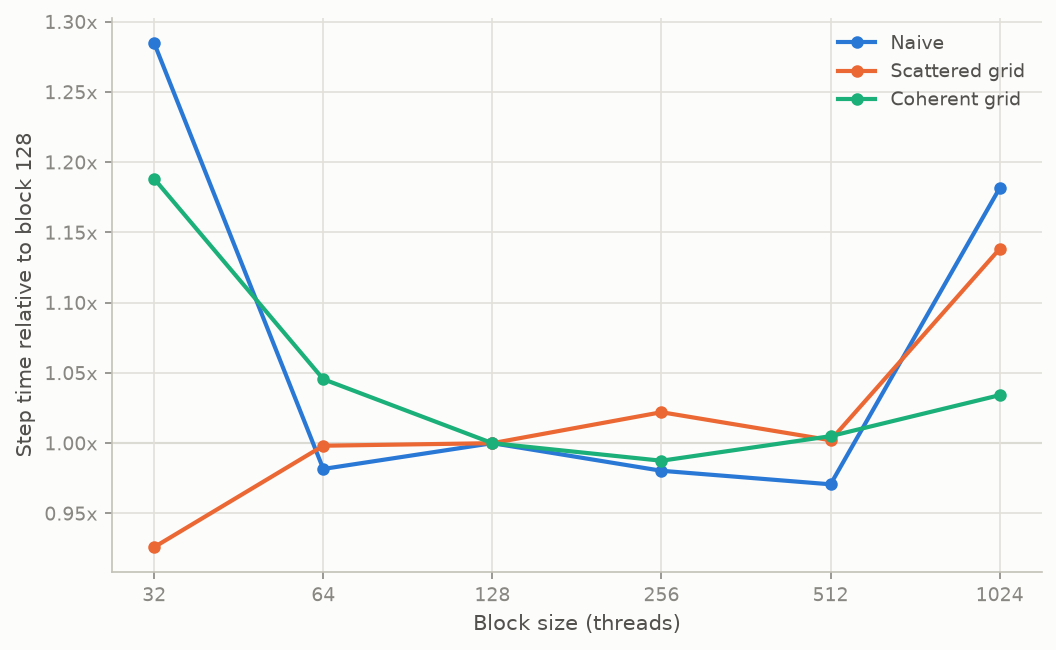
Data were collected at 200k boids, no visualization. The only parameter changing here is the block size.
It seemed weird that only scattered did well at a block size of 32, so I used cuobjdump --dump-resource-usage to check and calculate occupancy. An SM on the 3090 holds at most 16 resident blocks and 1536 resident threads (48 warps), so a block size of 128 seemed like a reasonable best-performance configuration. Registers could be a third cap, but the two neighbor-search kernels use 40 registers per thread, naive uses 35, and none of them use shared memory. 1536 x 40 = 61,440 fits in the 65,536-register file, so registers are not the issue here and occupancy comes down to block size alone.
| Block size | Resident blocks per SM | Resident warps | Occupancy | Coherent 200k, ms | Coherent 1M, ms | Scattered 200k, ms | Scattered 1M, ms |
|---|---|---|---|---|---|---|---|
| 32 | 16 (block cap) | 16 | 33% | 0.755 | 6.33 | 1.527 | 102.1 |
| 64 | 16 (block cap) | 32 | 67% | 0.665 | 4.18 | 1.646 | |
| 128 | 12 (thread cap) | 48 | 100% | 0.636 | 3.89 | 1.649 | 120.2 |
| 256 | 6 | 48 | 100% | 0.628 | 3.87 | 1.685 | |
| 512 | 3 | 48 | 100% | 0.639 | 3.85 | 1.652 | |
| 1024 | 1 | 32 | 67% | 0.657 | 3.94 | 1.877 |
- The 3090 allows 16 resident blocks per SM, so 32-thread blocks cap an SM at 16 warps out of 48, only a third of full occupancy. That means fewer warps to hide memory latency behind, which the performance data supports, except for scattered. With the scattered approach, 32 is its fastest block size. Perhaps this is because scattered is so memory bound that fewer warps in flight actually alleviate the cache thrashing, and that outweighs the occupancy loss, although this is not a verified conclusion.
- It also makes sense that performance gets worse at block size 1024 again, since its occupancy is only 2/3, and a big block size could cause more imbalance inside a block, causing finished warps to wait on the slowest warp.
Coherent vs scattered
- At 50k and below there’s no significant difference. Probably because there is so little GPU work, and the extra shuffle kernel in coherent costs about the same as what it saves.
- However, as the boid count ramps up we start to see a much more significant performance gain for coherent. This is likely due to the fact that higher boid count leads to much bigger arrays that do not fit comfortably in cache anymore, so many of the random neighbor reads would lead to a DRAM access.
- By doing some calculations: The 3090 has 6 MB of L2 cache. At 50K boids the
posarray, for example, would take 50K * 12 bytes = 0.6 MB. With all the other arrays this probably still fits under the 6 MB L2 cache. However, at 200k boids theposarray would take 200k * 12 bytes = 2.4 MB of data, and with the other arrays it just does not fit inside the 6 MB L2 cache.
27 vs 8 neighbor cells (note that the Y axis is log-scaled)
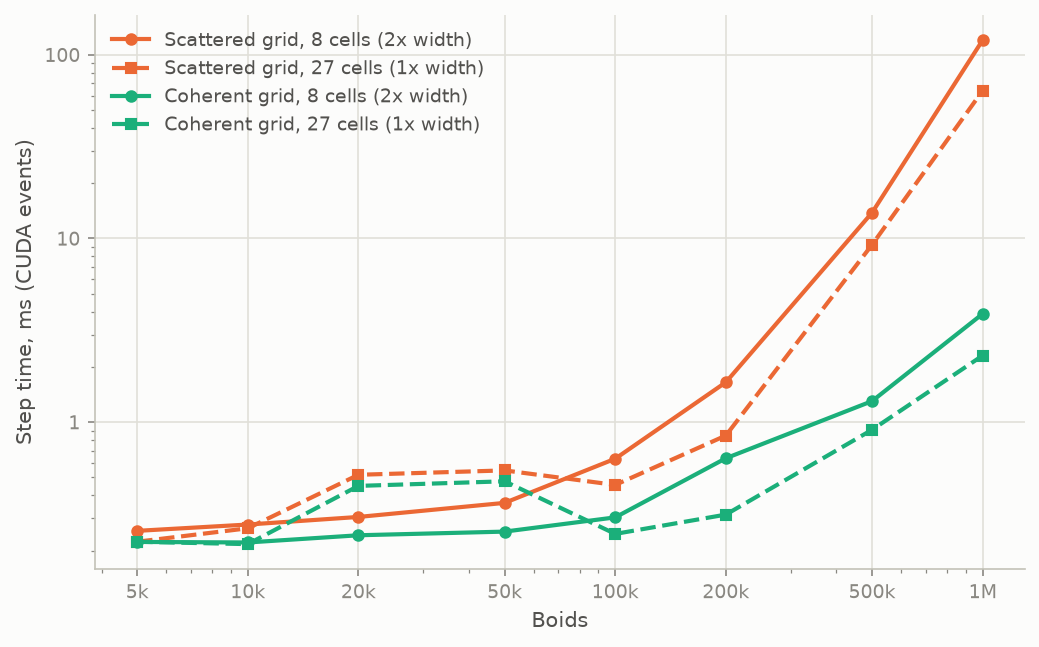
As for the 27 vs 8 cells performance overall:
- 27 cells performed consistently better from 100K boids up, and worse at 20K and 50K.
- I still have no clue why it would perform better at 100K and 200K compared to 20K and 50K. I used nvidia-smi to check GPU clock frequency during the run, as I thought perhaps the low boid count does not kick the GPU up to a higher clock speed, but the clock speed was pretty much identical between all boid counts.
- It is true that the 27-cell approach pays for more start/end lookups. However, it also reduces wasteful lookups because it checks a smaller area. Consider a boid checking its neighbors: there is a neighbor inside the 8-cell search area, but it is actually outside the maximum rule radius. Neighbors like this are looked up but ditched anyway at the end. With 27 cells, we reduce how often this kind of neighbor lookup happens, because we are searching within a tighter bound. This explains why the 27-cell approach wins by more at higher boid counts: the denser the boids, the more neighbor lookups the tighter bound saves.
Performance spikes
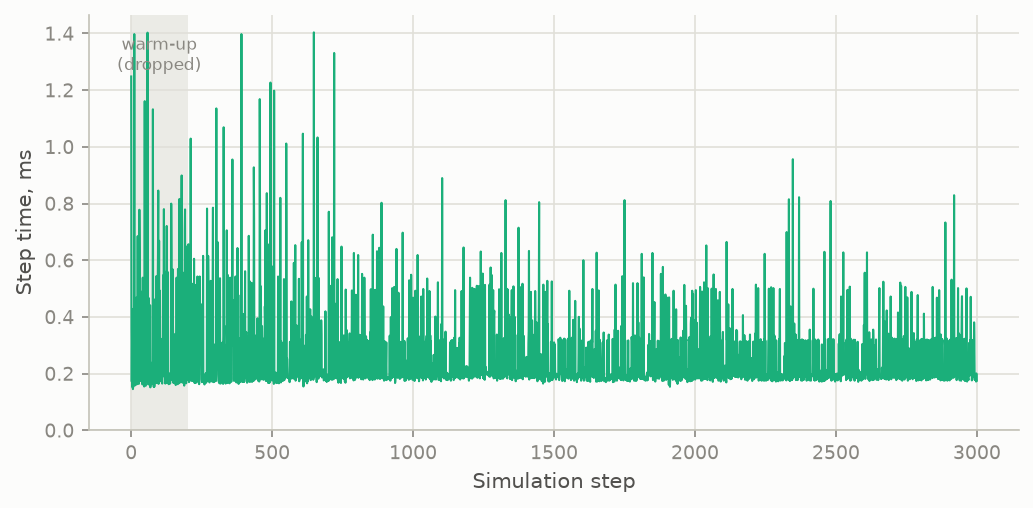
Because every frame is logged I could look at the distribution, and there are performance spikes in both grid-based approaches. I have not looked into why this is the case.
Notes
PROFILE is 0 by default in main.cpp, which is the normal interactive build with none of the profiling code compiled in. Set it to 1 to reproduce the measurements: the exe then takes label N steps on the command line, runs that many steps, writes label.csv and exits.
Tools Used
CUDA, C++, OpenGL, GLFW, Thrust, CMake